中文版English
Home > Products > Gold
Gold Futures Contract
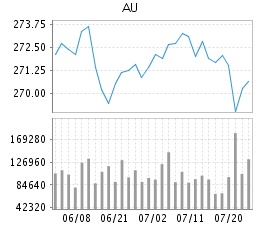
AU Price Chart

-
Contract Information Trading Day:2018-07-31Update:2018-07-31 13:26:08[more]
Code Listing Date Expiration Date First Delivery Day Last Delivery Day Benchmark Price au1808 20170718 20180815 20180816 20180822 275.75 au1809 20180619 20180917 20180918 20180925 272.05 au1810 20170918 20181015 20181016 20181022 286.95 au1812 20171116 20181217 20181218 20181224 281.75 au1902 20180116 20190215 20190218 20190222 285.65 au1904 20180316 20190415 20190416 20190422 280.50 au1906 20180516 20190617 20190618 20190624 279.40 au1908 20180717 20190815 20190816 20190822 275.95 -
Trading Parameter Trading Day:2018-07-31Update:2018-07-31 13:25:21[more]
Code Margin Rate Limit Up(%) Limit Down(%) Long Speculation(%) Short Speculation(%) Long Hedging(%) Short Hedging(%) au1808 10 10 10 10 4 4 au1809 5 5 5 5 4 4 au1810 5 5 5 5 4 4 au1812 5 5 5 5 4 4 au1902 5 5 5 5 4 4 au1904 5 5 5 5 4 4 au1906 5 5 5 5 4 4 au1908 5 5 5 5 4 4 -
Settlement Parameter Trading Day:2018-07-31Update:2018-07-31 13:27:30[more]
Note:
1.The transaction fee for closing out the position opened on the same day=the haircut rate for closing out the position opened on the same day * transaction fee, which is waived then the value is zero.
2.Transaction fee for gold futures shall refer to the amount of transaction fee.Code Settle Fee Percentage(‰) Trans
Fee(RMB
/lot)DeliveryFee(RMB
/gram)Margin Rate Discount Rate for Closing-out Today’s Position (%) Long
Speculation
(%)Short
Speculation
(%)Long
Hedging
(%)Short
Hedging
(%)au1808 0.000 10 0.06 10 10 10 10 0 au1809 0.000 10 0.06 5 5 5 5 0 au1810 0.000 10 0.06 5 5 5 5 0 au1812 0.000 10 0.06 5 5 5 5 0 au1902 0.000 10 0.06 5 5 5 5 0 au1904 0.000 10 0.06 5 5 5 5 0 au1906 0.000 10 0.06 5 5 5 5 0 au1908 0.000 10 0.06 5 5 5 5 0 -
Delivery Parameter Trading Day:2018-07-31Update:2018-07-31 13:26:22[more]
Code Delivery and Settlement Price Delivery Margin Rate
(%)Physical Delivery Unit Price(RMB/gram) First Delivery Day Last Delivery Day Tax-paid Bonded au1808 20 0.06 20180816 20180822 au1809 20 0.06 20180918 20180925 au1810 20 0.06 20181016 20181022 au1812 20 0.06 20181218 20181224 au1902 20 0.06 20190218 20190222 au1904 20 0.06 20190416 20190422 au1906 20 0.06 20190618 20190624 au1908 20 0.06 20190816 20190822 -
Monthly Informatio Update:2018-07-31 13:25:01
Code Trading Month Trading Day Trading Margin Rate(%) Fee Percentage(‰) Unit Price of Trans.Fee(RMB/Contract) au1807 201807 20180629 15.00 0.000 10 au1807 201807 20180711 20.00 0.000 10 au1808 201807 20180629 10.00 0.000 10 au1808 201807 20180711 10.00 0.000 10 au1808 201807 20180717 10.00 0.000 10 au1809 201807 20180629 5.00 0.000 10 au1809 201807 20180711 5.00 0.000 10 au1809 201807 20180717 5.00 0.000 10 au1810 201807 20180629 5.00 0.000 10 au1810 201807 20180711 5.00 0.000 10 au1810 201807 20180717 5.00 0.000 10 au1812 201807 20180629 5.00 0.000 10 au1812 201807 20180711 5.00 0.000 10 au1812 201807 20180717 5.00 0.000 10 au1902 201807 20180629 5.00 0.000 10 au1902 201807 20180711 5.00 0.000 10 au1902 201807 20180717 5.00 0.000 10 au1904 201807 20180629 5.00 0.000 10 au1904 201807 20180711 5.00 0.000 10 au1904 201807 20180717 5.00 0.000 10 au1906 201807 20180629 5.00 0.000 10 au1906 201807 20180711 5.00 0.000 10 au1906 201807 20180717 5.00 0.000 10 au1908 201807 20180717 5.00 0.000 10
Market Data and Charts are delayed at least 30 minutes.
| Contract | Last | Chg | Open Interest | Volume | Bid-Ask | Pre-clear | Open | Comment |
| Contract | Weighted Average Price 9:00-10:15 |
Change over Previous Trading Day | Weighted Average Price 9:00-15:00 |
Change over Previous Trading Day |